- The cheapest inspection robot is often the most expensive deployment
- Integration, operations, and data governance are the largest hidden cost drivers
- Cost should be measured as cost per asset, route, or avoided failure — not hardware price
- Managed inspection outcomes shift risk — you buy results, not equipment
- A strong procurement process defines workflow, evidence, integration, and accountability
Introduction: Why Most Inspection Automation Cost Models Are Wrong
When organisations evaluate inspection automation, the first question is usually: "How much does the robot cost?"
This is the wrong starting point.
In real deployments, hardware typically represents only a small portion of total cost. The true cost drivers include deployment complexity, integration with existing systems, ongoing operations and maintenance, data validation and governance, and organisational change and adoption.
This leads to a common outcome: a low-cost system that fails to deliver value — and becomes expensive over time. This guide provides a practical framework for evaluating inspection automation cost correctly.
What "Good" Looks Like in an Inspection Cost Model
A high-quality inspection automation cost model should:
- Reflect Full Lifecycle Costs — include deployment, integration, and operations, not just hardware
- Align Cost to Outcomes — cost per inspection route, cost per asset inspected, cost per avoided failure
- Capture Risk Transfer — who is accountable when the system fails?
- Enable Vendor Comparability — apples-to-apples evaluation
- Support Decision-Making — transparent assumptions and clear ROI logic
Cost Driver Taxonomy: Where Money Actually Goes
Inspection automation cost is not evenly distributed. Hardware is visible. Everything else determines success or failure.
| Cost Category | Description | Typical Oversight |
|---|---|---|
| Hardware | Robots, sensors, cameras, on-device components | Overemphasised |
| Deployment | Setup, site assessment, commissioning, training | Underestimated |
| Integration | CMMS/EAM, IT/OT systems, data pipelines, APIs | Often ignored |
| Operations | Monitoring, staffing, managing false positives, uptime | Hidden |
| Maintenance | Repairs, calibration, software updates | Underestimated |
| Data Management | Storage, validation, governance, audit trails | Rarely included |
| Training | Workforce enablement and adoption | Often missed |
Hardware is visible. Everything else determines success or failure.
The Biggest Hidden Cost Drivers
1. Deployment Complexity
Deployment is rarely as simple as unpacking equipment. Hidden costs emerge from site constraints, safety requirements and access limitations, environmental conditions, and the coordination overhead of working in live operational environments.
2. Integration Scope
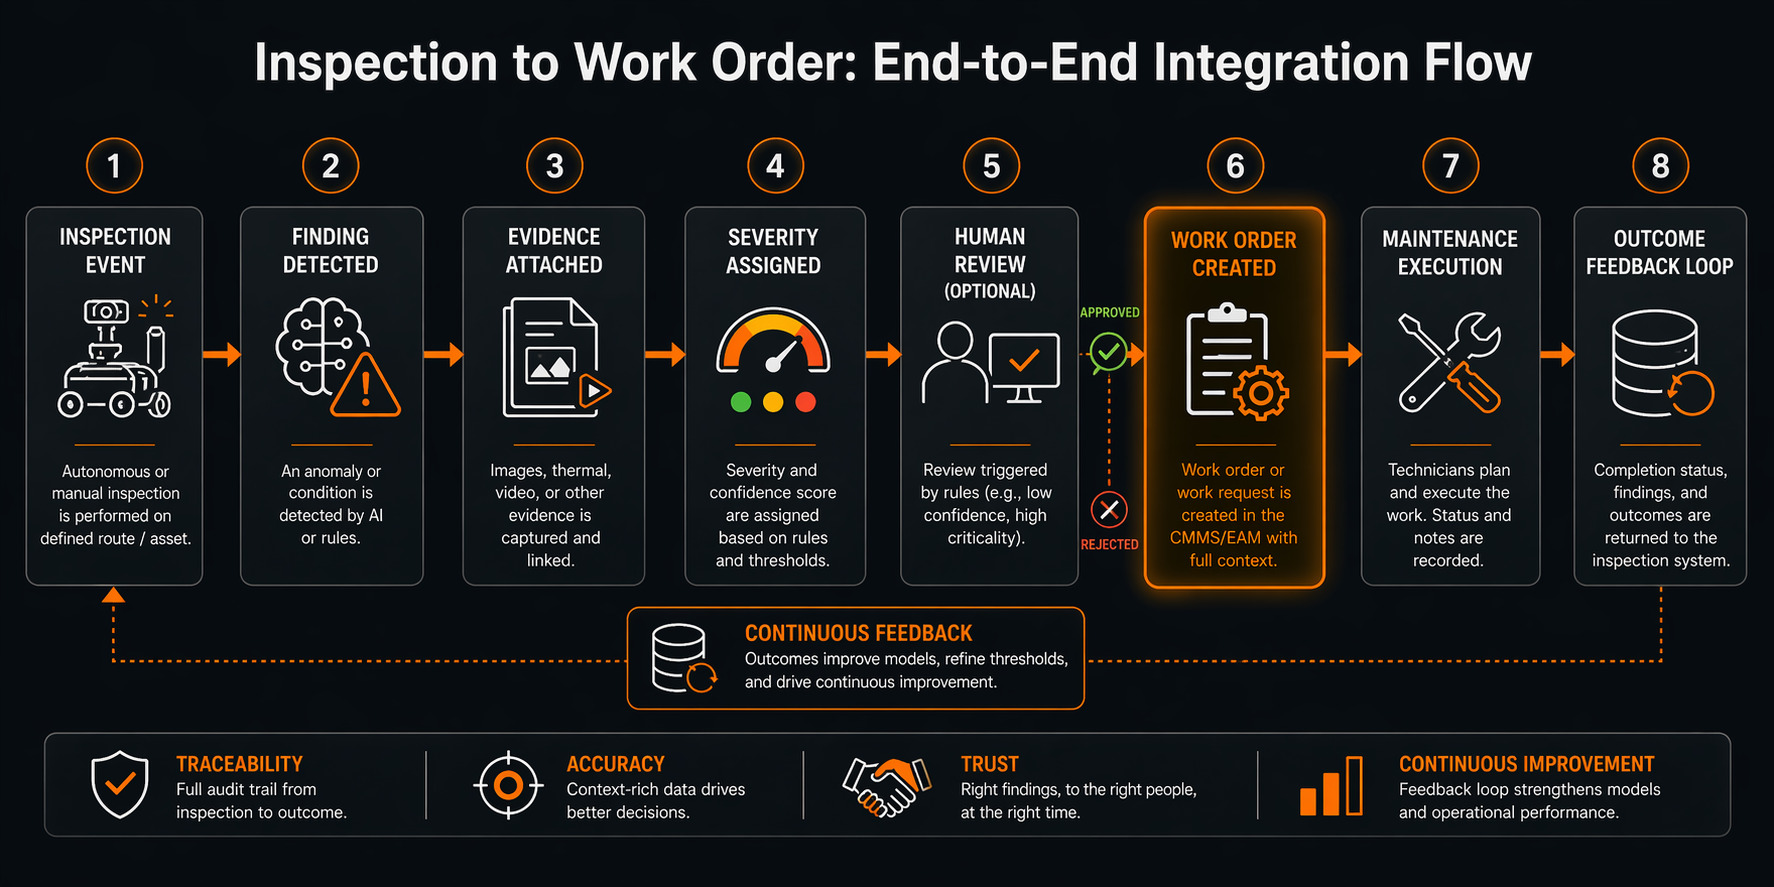
Connecting inspection systems to CMMS/EAM platforms, asset databases, and reporting systems is frequently underestimated or ignored entirely during procurement. Without integration, there is no automated action and no ROI.
3. Operational Overhead
Someone must monitor results, manage false positives, maintain uptime, and respond to system exceptions. This ongoing workload is invisible in a hardware price but materialises immediately after deployment.
4. Data Governance
Reviewing inspection data, validating anomalies, and maintaining audit trails is a continuous cost. Organisations that ignore this upfront will find it defining their cost structure later.
If you don't define these upfront, they will define your cost later.
Cost Framing: How to Evaluate Value Correctly
Avoid evaluating cost per robot. Use these metrics instead:
- Cost per Inspection Route — total cost to complete a full inspection cycle
- Cost per Asset Inspected — normalised cost across the asset population
- Cost per Avoided Failure — the most important metric, incorporating downtime avoided, repair cost savings, and safety risk reduction
| Metric | Example Value |
|---|---|
| Cost per route | $200 – $500 |
| Cost per asset | $5 – $20 |
| Cost per avoided failure | $50k – $500k |
Scenario-Based Cost Model: Manual vs Automated
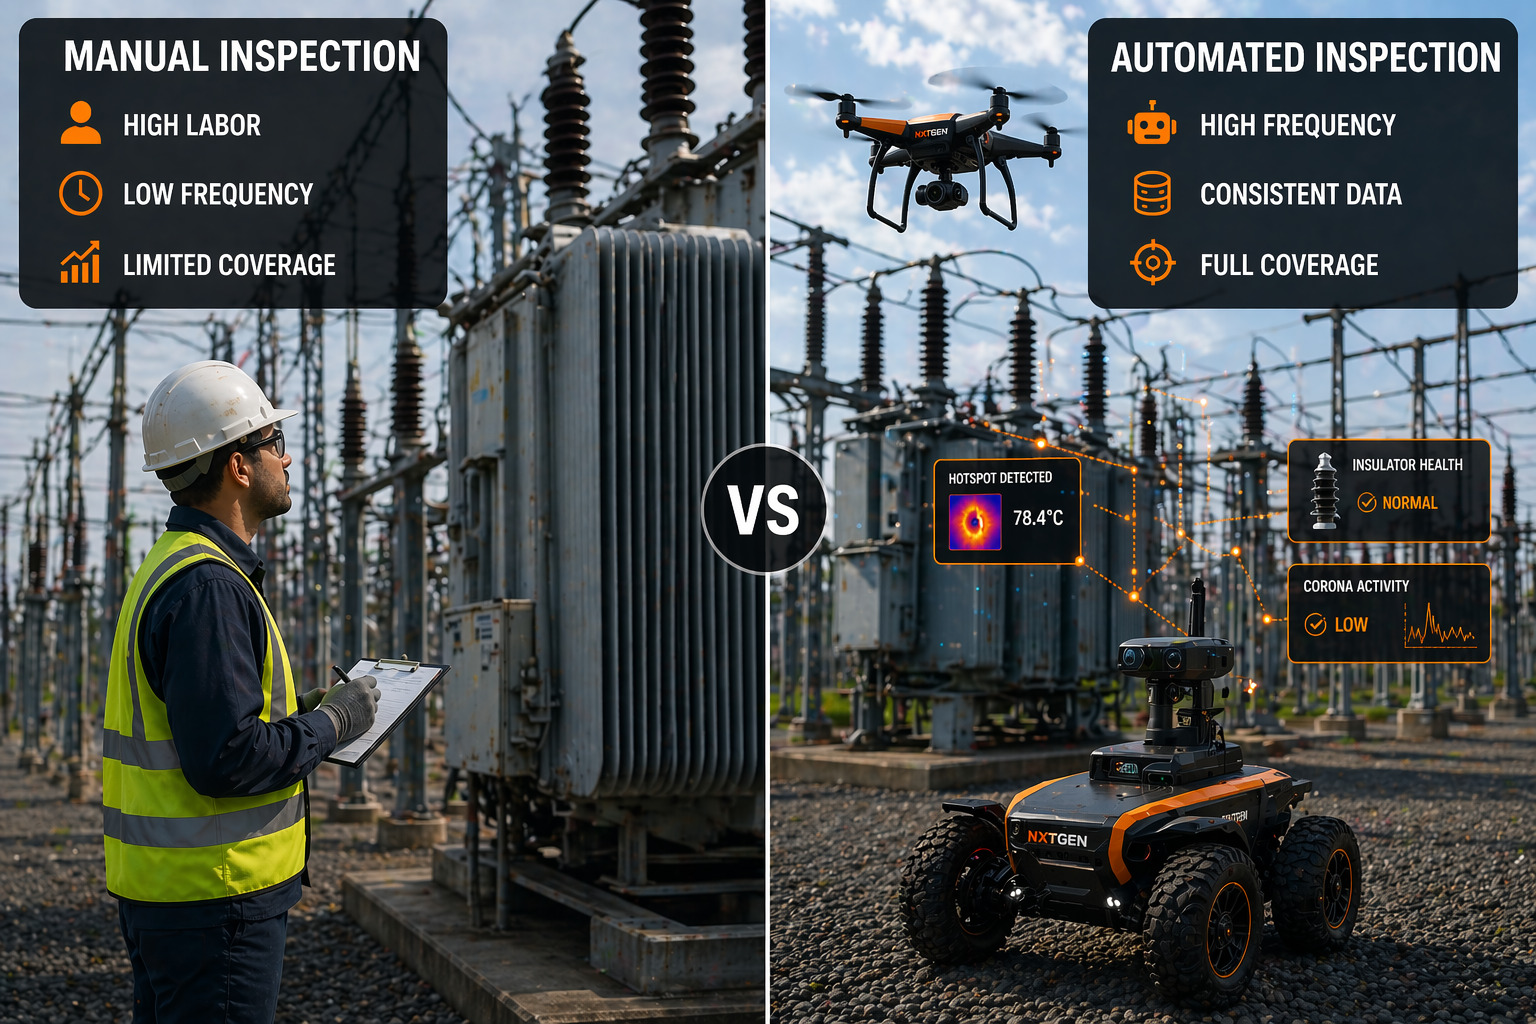
Using substation inspection as an example — 1 site, 500 assets, weekly inspection frequency — the outcome comparison is stark:
| Cost Element | Manual | Automated |
|---|---|---|
| Labor | High | Reduced |
| Safety Risk | High | Lower |
| Inspection Frequency | Low | High |
| Data Quality | Variable | Consistent |
| Downtime Risk | Higher | Reduced |
Automated inspection carries higher upfront cost but lower long-term cost, reduced risk, and better decisions — compounding in value over every inspection cycle.
DIY vs Managed Inspection: The Critical Procurement Decision
The most significant procurement decision is not which robot to buy — it is which model to operate under.
| Factor | DIY | Managed Outcomes |
|---|---|---|
| Upfront Cost | Lower | Higher |
| Risk | High (buyer owns it) | Lower (vendor owns it) |
| Complexity | High | Lower |
| Time to Value | Slow | Faster |
| Accountability | Internal | Vendor |
Managed models shift risk from the buyer to the provider. You buy inspection results — not equipment, complexity, or operational overhead.
Procurement Framework: What You Should Actually Evaluate
A strong RFP must define each of the following clearly. If a vendor cannot answer these, you are not buying outcomes — you are buying risk.
- Inspection Workflow — what is inspected, how often, and how consistently
- Evidence Requirements — what data is captured and to what quality standard
- Integration Scope — which systems are connected and how actions are triggered
- Operational Model — who monitors the system and who responds to findings
- Performance Metrics — accuracy, uptime, and response time with defined accountability
ROI Modeling: How to Justify Investment
The core ROI drivers for inspection automation are: reduced labour, reduced downtime, reduced safety incidents, increased inspection frequency, and extended asset life.
ROI = (Avoided failures + savings + efficiency gains) − total system cost
The key is to model each driver separately with transparent assumptions — not collapse them into a single percentage that nobody can defend.
Common Failure Modes
- Buying based on hardware cost — fix: evaluate lifecycle cost
- Ignoring integration — fix: define scope upfront before any vendor selection
- Underestimating operations — fix: model the ongoing workload explicitly
- Undefined outcomes — fix: tie cost to measurable metrics from day one
- Poor vendor evaluation — fix: use structured procurement frameworks, not product demos
Why Full-Stack Outcomes Win
Robotics-only vendors sell equipment and leave complexity to you. SaaS vendors analyse data but depend on external inputs. Neither delivers accountable outcomes.
A full-stack approach delivers deployment-ready systems, integrated workflows, managed operations, and measurable outcomes — shifting the model from equipment procurement to operational performance.
You are not buying a robot. You are buying inspection outcomes over time.
Conclusion
Inspection automation cost is not a pricing question. It is a system design and procurement decision.
Organisations that succeed evaluate full lifecycle cost, align cost to outcomes, define workflows clearly, and choose models that reduce risk. Those that don't will discover the hidden costs the hard way — after deployment.