- Measure coverage and frequency first, not AI accuracy
- Focus on lead indicators: routes completed, evidence quality, exception rate
- Track lag indicators: reduced urgent work, fewer repeat faults, lower exposure
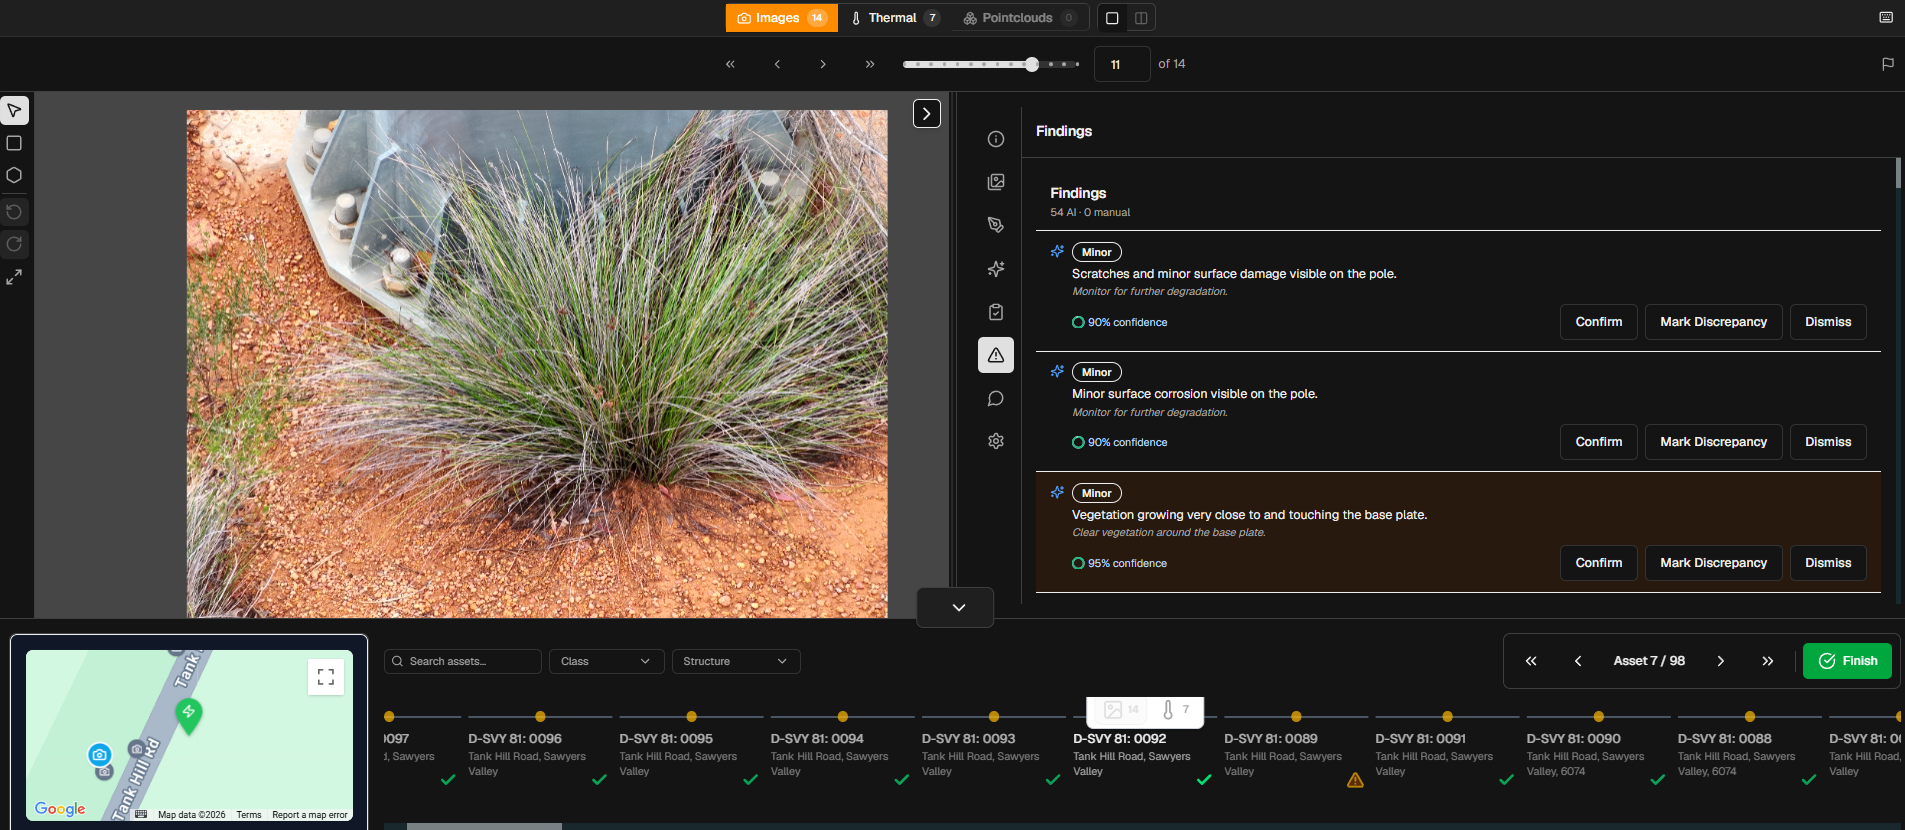
- Close the loop: finding → action → completion → verification
- KPIs only matter when tied to decision rights and escalation workflows
Introduction: Why Most Inspection Outcomes KPIs Fail to Deliver Value
Inspection KPI dashboards often look impressive — but deliver little operational value. They show image counts, uptime charts, alert volumes, AI accuracy scores, and generic trends. But the real questions operators and leaders need answered are: Are inspections happening consistently? Are issues being detected earlier? Are maintenance decisions improving? Are we reducing urgent work and risk exposure? Is the program creating measurable value?
Inspection outcomes KPIs must be designed around operational reality, not dashboard aesthetics. A dashboard that cannot answer these questions is a reporting exercise — not a management tool.
What Good Inspection Outcomes KPI Design Looks Like
A strong KPI framework reflects operational reality, links inspection to decision-making, supports escalation, and measures improvement in safety, maintenance, and coverage. Good KPI design begins with a clear answer to one question: what operational decision does this metric support?
If a metric cannot be connected to a decision, it belongs in a report — not an operating dashboard.
The Four KPI Layers That Matter for Inspection Outcomes
Inspection outcomes KPIs are most useful when structured in four distinct layers. Each layer builds on the one below it.
1. Coverage KPIs
Coverage KPIs measure whether the inspection program is executing as planned. The core metrics are: percentage of routes completed on schedule, percentage of assets inspected within the required frequency window, and planned versus actual inspection frequency by asset class or zone.
Without coverage discipline, every downstream metric is unreliable. A high exception rate from a 40% coverage program tells you almost nothing useful.
2. Evidence Quality KPIs
Evidence quality KPIs measure whether the data captured is fit for decision-making. The core metrics are: percentage of routes passing QA checks, percentage of findings with sufficient context for a reviewer to act, and recapture rate — the proportion of inspections that had to be repeated due to poor data quality.
Evidence quality determines whether findings can be trusted. Low-quality evidence generates review overhead, increases false positive rates, and erodes operator confidence in the program.
3. Action KPIs
Action KPIs measure the responsiveness of the inspection-to-maintenance loop. The core metrics are: finding-to-review cycle time, finding-to-work-order cycle time, percentage of findings resulting in a defined action, and exception closure rate over rolling periods.
Slow action cycle times indicate bottlenecks in review workflows, unclear escalation paths, or insufficient resourcing for finding triage. These are operational failures — not inspection failures.
4. Outcome KPIs
Outcome KPIs measure whether the inspection program is delivering business value. The core metrics are: reduction in urgent callouts, reduction in repeat faults on inspected assets, reduction in safety exposure hours, reduction in rework linked to late detection, and improvement in planned versus reactive maintenance ratio.
Lead vs Lag Indicators: The Inspection Outcomes Framework
The distinction between lead and lag indicators is critical for managing inspection programs at different operational cadences.
Lead Indicators — Operational Health Now
Lead indicators tell you whether the inspection system is functioning correctly today. They include: routes completed versus planned, inspection frequency versus target, evidence completeness scores, exception rate per route or asset class, and review SLA compliance.
Lead indicators are owned by operations and reviewed weekly. They identify execution gaps before those gaps affect outcomes.
Lag Indicators — Business Value Over Time
Lag indicators tell you whether the inspection program is delivering its intended value over time. They include: fewer urgent interventions per quarter, reduced repeat failure rate on inspected assets, lower exposure hours for inspection personnel, improved maintenance planning ratios, and reduced unplanned downtime linked to late detection.
Lag indicators are owned by reliability and reviewed monthly or quarterly. They provide the strategic justification for continuing and scaling the program.
Core Inspection Outcomes KPI Reference Table
The following table summarises the core inspection outcomes KPIs across all four layers, with type classification and the operational rationale for each.
| KPI | Type | Why It Matters |
|---|---|---|
| Route completion rate | Lead | Execution discipline — confirms inspections are happening as planned |
| Asset coverage rate | Lead | Program reach — confirms all required assets are being inspected |
| Evidence quality pass rate | Lead | Trust in findings — confirms data is fit for decision-making |
| Exception rate | Lead | Signal vs noise — confirms thresholds are calibrated correctly |
| Finding-to-work-order cycle time | Action | Responsiveness — identifies bottlenecks in the review and escalation path |
| Work-order loop closure rate | Action | Follow-through — confirms findings are resolved, not just raised |
| Reduction in urgent callouts | Lag | Planning improvement — demonstrates shift from reactive to planned maintenance |
| Reduced exposure hours | Lag | Safety improvement — quantifies reduction in personnel risk from inspection automation |
The Finding-to-Outcome Loop: The Core Inspection Measurement Model
Every inspection program must be able to measure the full finding-to-outcome loop. This loop is the operational backbone of any evidence-based inspection program — and it is the structure that inspection outcomes KPIs must instrument end to end.

The loop has seven stages:
- Inspection completed — Route executed, coverage confirmed
- Evidence captured — Data collected and QA-validated
- Finding identified — Exception or anomaly detected and classified
- Severity assigned — Priority determined, escalation path confirmed
- Action raised — Work order or maintenance task created
- Maintenance executed — Corrective action completed in the field
- Outcome verified — Finding resolved and closed, asset condition confirmed
Decision Rights and Governance: Making Inspection Outcomes KPIs Actionable
KPIs only work when tied to ownership and action. A metric without a defined owner is noise. The following governance model assigns clear ownership across the KPI layers, ensuring each metric has a decision-maker and an escalation path.
| Governance Area | Owner |
|---|---|
| Coverage KPIs | Operations |
| Evidence Quality | Inspection Program Lead |
| Thresholds & Classification | Reliability / Engineering |
| Outcome Reporting | Leadership / Reliability |
| Data Integrity | Platform / Data Owner |
Reporting Cadence: Matching Review Frequency to Decision Type
Inspection outcomes KPIs should be reviewed at different cadences depending on the decision they support. Reviewing all KPIs at the same frequency creates either noise (too frequent) or blind spots (too infrequent).
Weekly — Operational Control
Weekly review covers: route completion, evidence quality scores, exception volume, and backlog review. These are operational metrics owned by site teams and inspection program leads. The purpose is to identify execution gaps before they compound.
Monthly — Program Performance
Monthly review covers: action cycle times, finding-to-work-order closure rates, repeat fault trends, and workflow bottlenecks. These are performance metrics owned by reliability and operations leadership. The purpose is to identify systemic issues in the inspection-to-maintenance flow.
Quarterly — Strategic Outcomes
Quarterly review covers: urgent callout reduction trends, exposure reduction, ROI indicators, and program scaling decisions. These are strategic metrics owned by leadership and reliability engineering. The purpose is to demonstrate value and justify investment decisions.
Common Inspection Outcomes KPI Failure Modes
Most inspection KPI frameworks fail for one or more of the following reasons.
- Vanity Metrics — Metrics that look good but do not connect to decisions. Fix: tie every KPI to a specific operational or strategic decision before adding it to a dashboard.
- Over-Focus on AI Accuracy — Treating model accuracy as the primary measure of program health. Fix: prioritise coverage completeness and action flow first. AI accuracy matters — but only in context of a functioning operational loop.
- No Outcome Link — Measuring inspection activity without connecting to maintenance or safety outcomes. Fix: instrument the full finding-to-outcome lifecycle and report closure rates alongside detection rates.
- Undefined Ownership — Metrics that exist in a report but have no defined owner or escalation path. Fix: assign governance clearly using a model like the one above before the program launches.
- Too Many Metrics — Dashboards with 30+ indicators that no one monitors consistently. Fix: define a core operating set of 6–10 metrics and add supplementary metrics only when they support a specific identified need.
Why Inspection Outcomes KPIs Win Over Activity Metrics
Organisations investing in inspection automation are not buying dashboards. They are buying better coverage, faster maintenance decisions, reduced risk exposure, and improved planning ratios. Inspection outcomes KPIs measure whether the program is delivering these things — activity metrics do not.
An inspection program that captures 10,000 images per week and generates 500 alerts is not necessarily performing well. An inspection program that completes 98% of planned routes, maintains a 95% evidence quality pass rate, closes findings within 48 hours, and has reduced urgent callouts by 30% over six months — that is a program delivering measurable value.
The shift from activity metrics to inspection outcomes KPIs is the shift from measuring a system to managing a program.
FAQ: Inspection Outcomes KPIs
What are the most important inspection outcomes KPIs?
Coverage rate, evidence quality pass rate, finding-to-work-order cycle time, and lag outcome metrics such as reduced urgent callouts and lower repeat fault rates. These four areas span the full value chain from execution discipline to business outcome.
Should AI detection accuracy be the main KPI for an inspection program?
No. AI accuracy is a component quality metric — it tells you whether the detection layer is performing within expected parameters. Operational KPIs such as coverage, action cycle time, and outcome trends matter more for program governance. Start with operational metrics, and instrument AI quality metrics as part of ongoing model management.
What is a lead indicator in the context of inspection outcomes?
A lead indicator is a metric that tells you whether the inspection program is operating correctly before outcomes appear. Route completion rate, evidence quality, and exception rate are all lead indicators. They give you the ability to identify problems and correct them before they affect maintenance performance or safety outcomes.
How often should inspection outcomes KPIs be reviewed?
Weekly for operational control metrics (coverage, evidence quality, exception volume), monthly for program performance metrics (cycle times, closure rates, repeat fault trends), and quarterly for strategic outcome metrics (urgent callout reduction, exposure reduction, ROI indicators).
Conclusion
Inspection outcomes must be measured through operational improvement — not dashboard activity. The inspection outcomes KPIs that matter are the ones that connect coverage discipline to evidence quality, evidence quality to action speed, and action speed to measurable improvements in maintenance performance and safety.
Design your KPI framework around the finding-to-outcome loop, assign clear governance, review at the right cadence, and tie every metric to a decision. That is how inspection programs prove — and sustain — their value.
For further detail on how inspection data connects to maintenance execution, see our articles on inspection automation cost modelling and CMMS/EAM integration for inspection.